Investment Tips3 MIN READ

Ask Your Advisor: Which fund should I put my money into?

Choosing the right exchange traded funds (ETFs) is crucial in this volatile market. Strategic allocation is easier when you track performance
June 8, 2026 by Janssen Roman
Share this article:
Featured Article Image

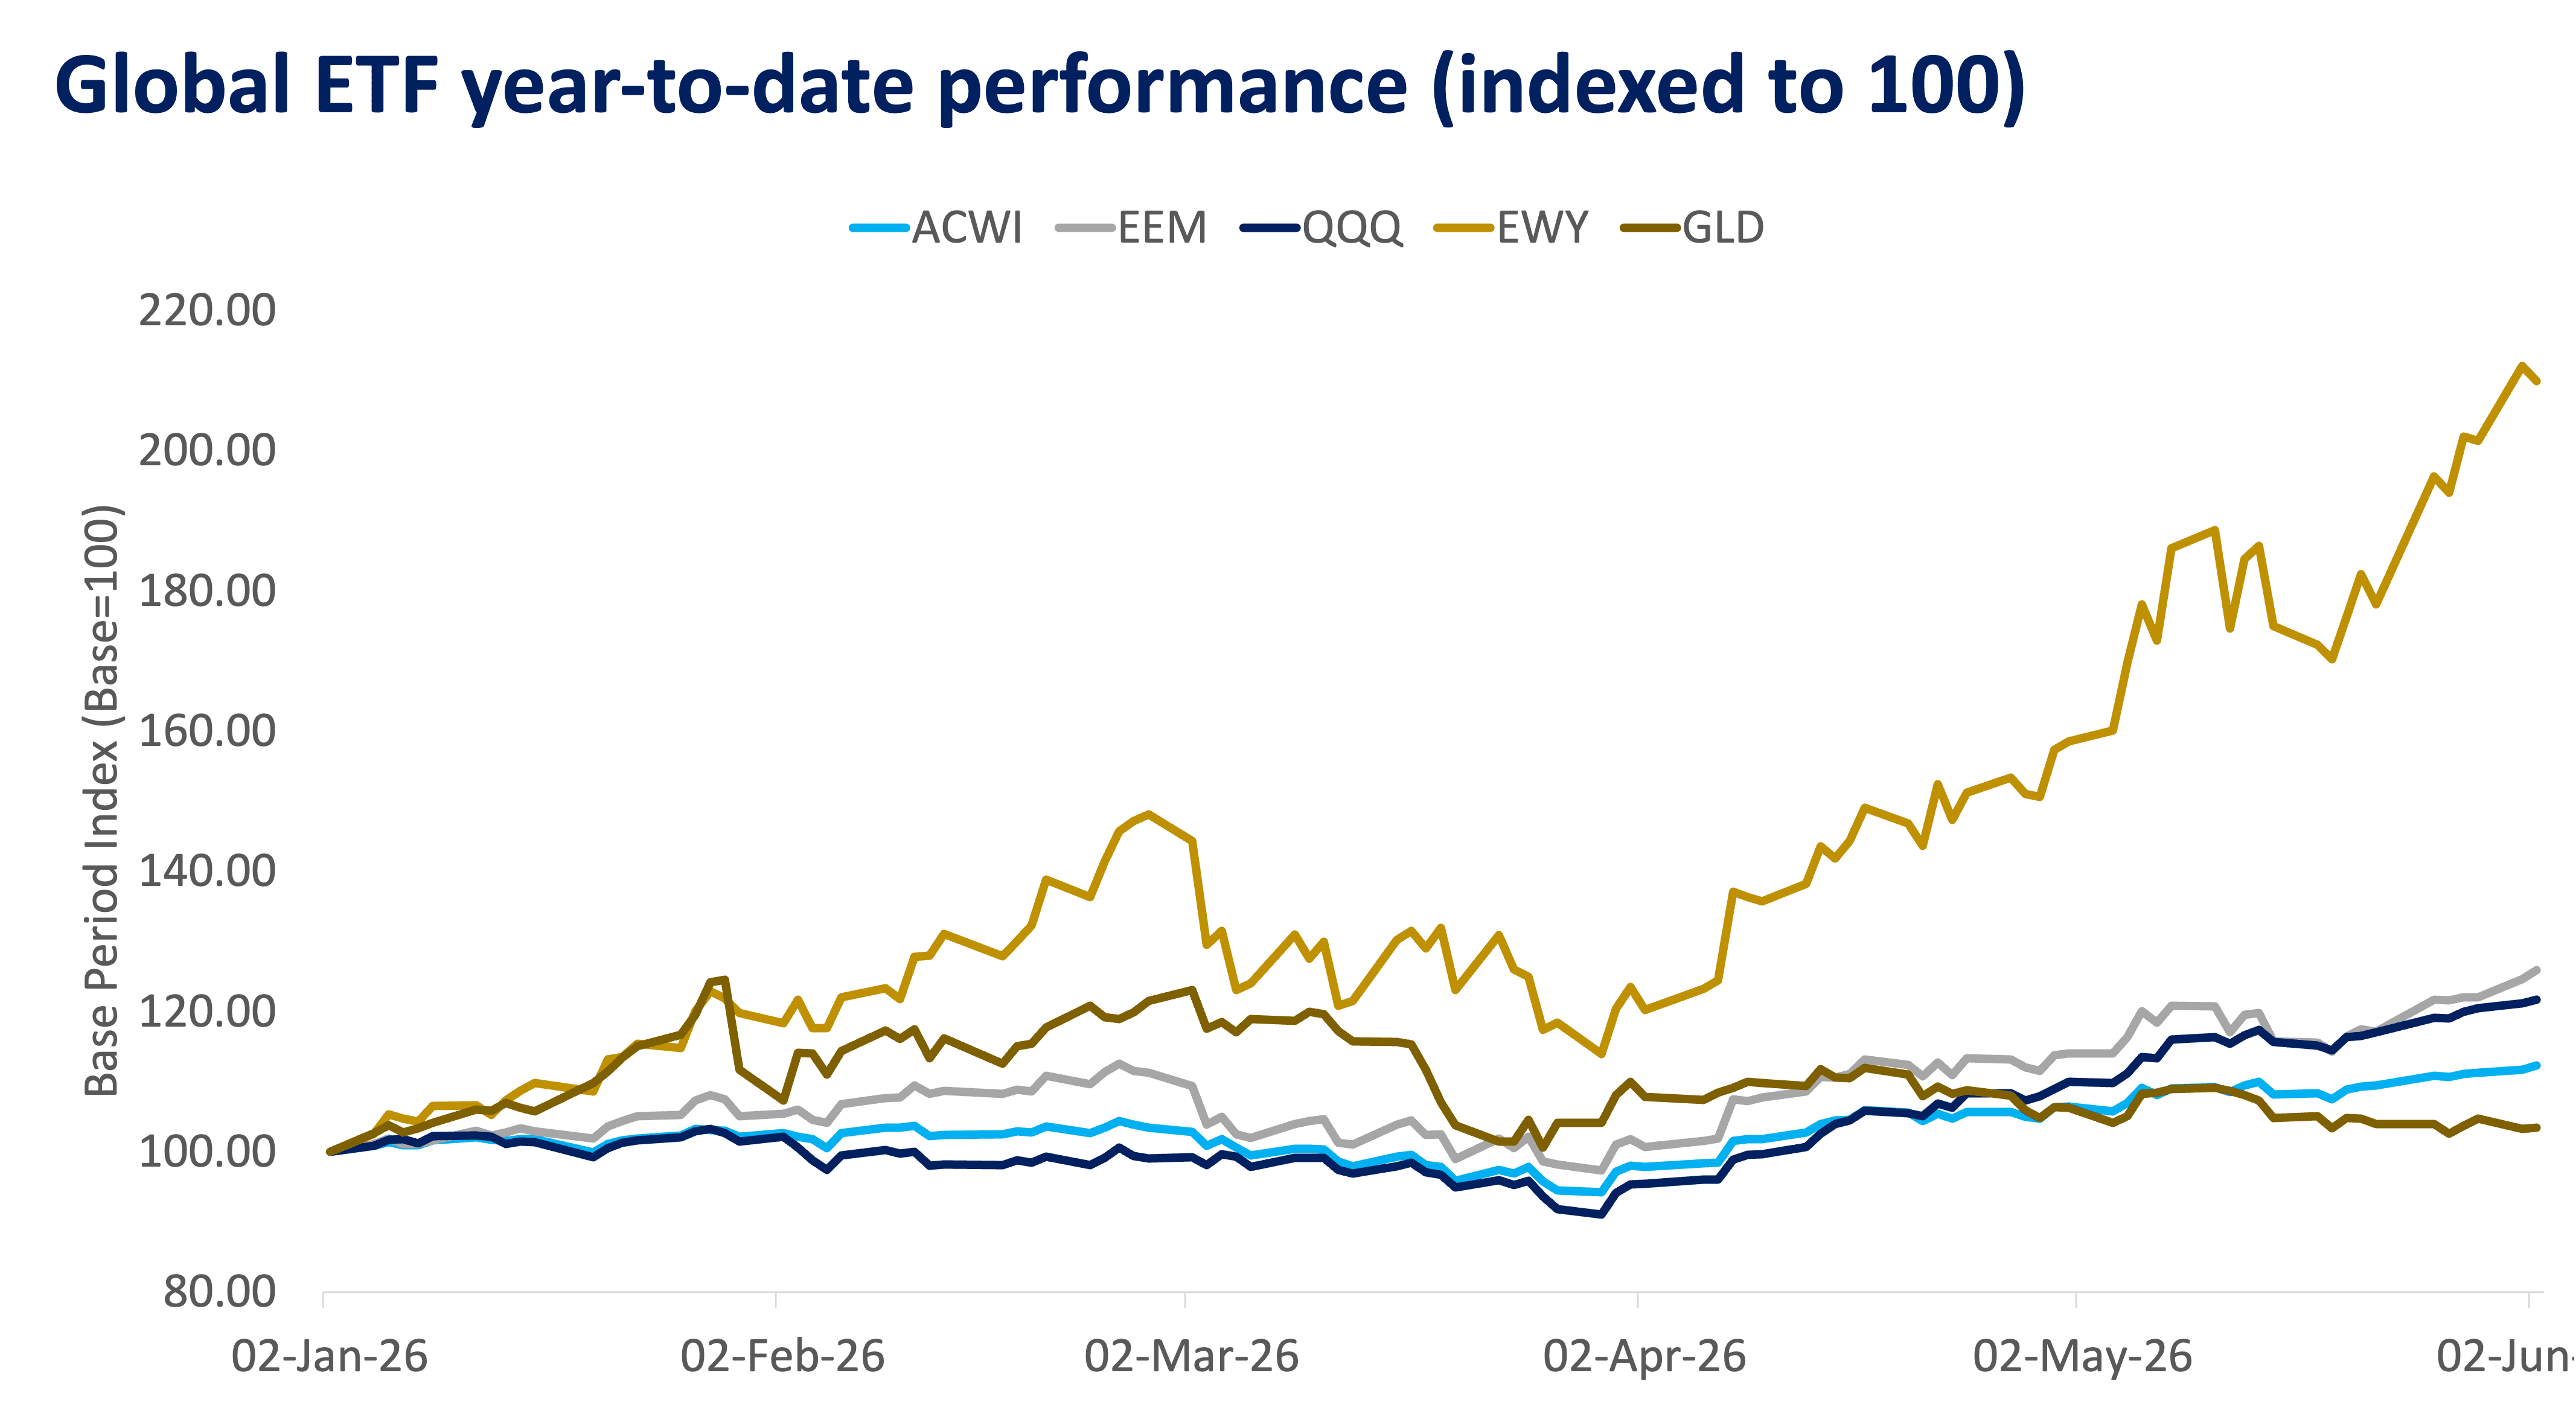
Global markets began 2026 on relatively equal footing, but performance paths diverged sharply from March onwards. What initially appeared to be a broad-based rally has evolved into a highly selective market, where returns are increasingly concentrated in specific regions.

Most major exchange-traded funds (ETFs)—including Broad Global Equities (ACWI), US Tech (QQQ), and Emerging Markets (EEM)—gradually climbed into the 110–125 index range, which means they booked 10% to 25% gains. One market, however, broke away decisively. At the same time, gold shares (GLD) followed a separate path, rallying early before retracing those gains. 

A closer look at the divergence

The chart (indexed performance) highlights how markets tracked closely early in the year, before dispersion widened significantly from March onwards. 

Source: Bloomberg 

  • South Korean equities (EWY) surged from ~100 to above 210, dramatically outperforming
  • QQQ and EEM posted steady recoveries, ending around 120–125 range
  • ACWI trailed slightly at ~110–115
  • GLD peaked near 125 in February before retracing to ~103, suggesting an early rotation out of defensive positioning as risk appetite improved


What began as a synchronized start to the year evolved into a highly selective, momentum-driven market. 


South Korea (EWY): The Standout Outperformer

Source: Bloomberg 

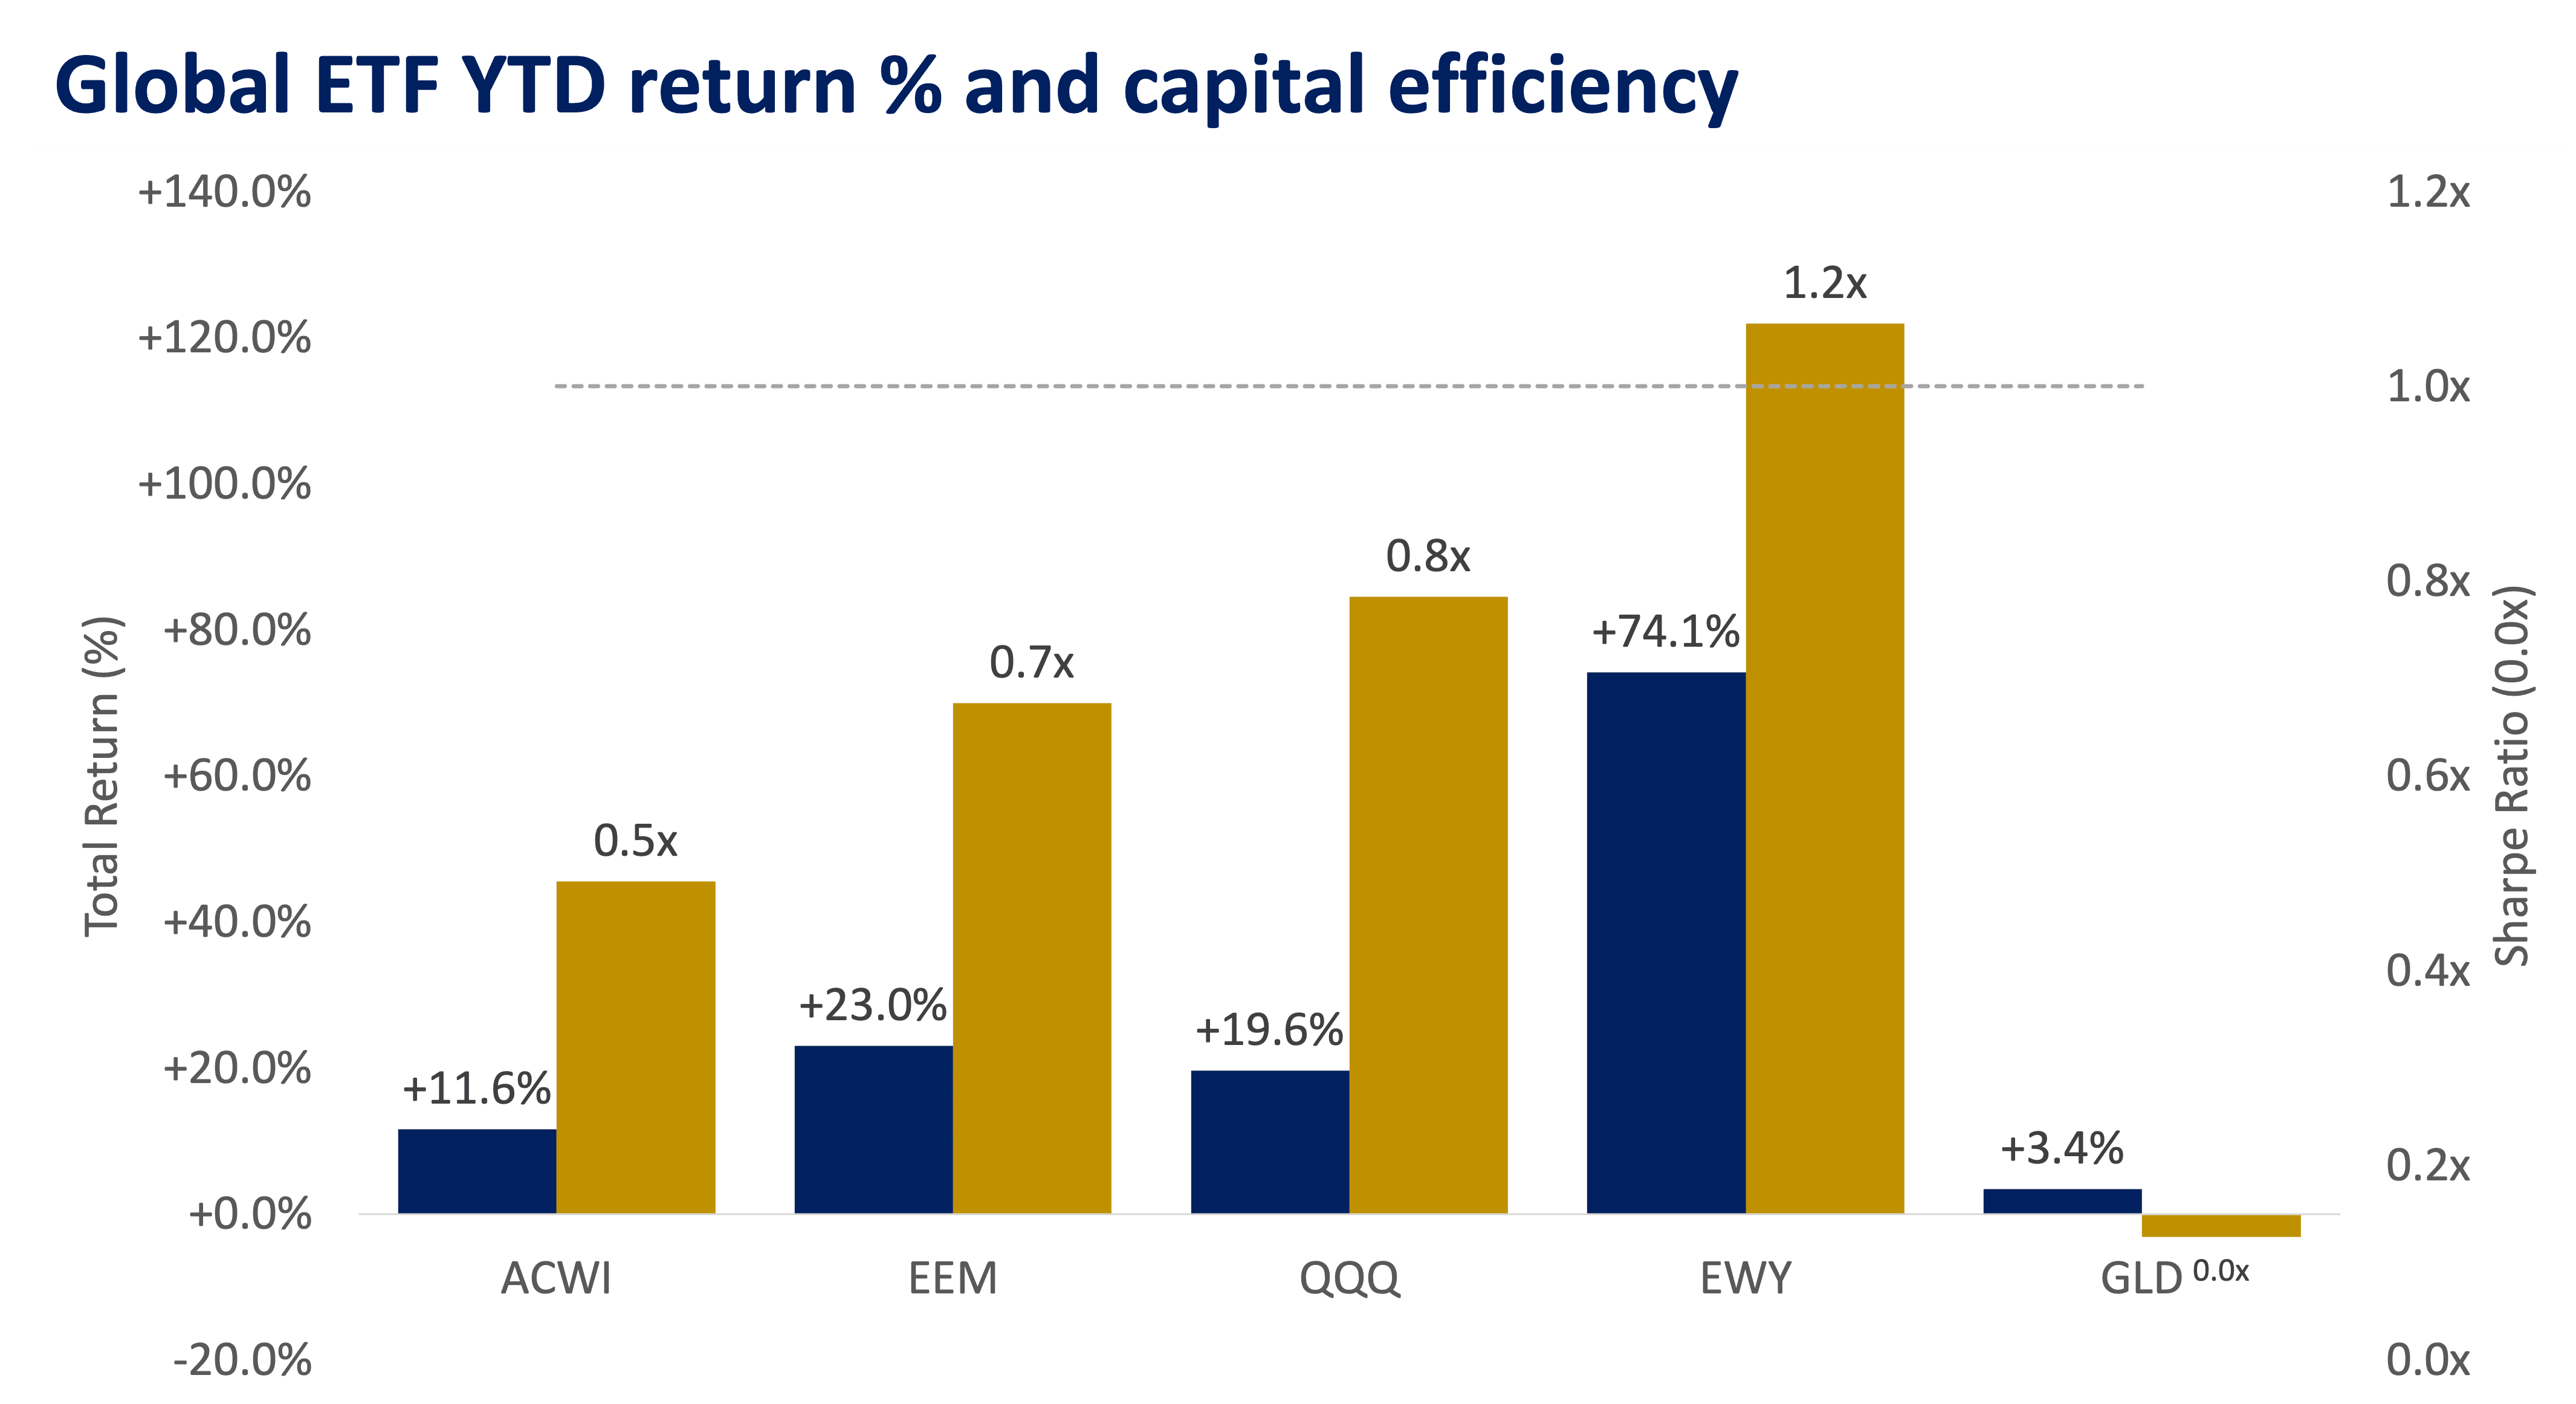
South Korea stands out as the dominant outperformer, with EWY rising to above 210 on an indexed basis, equivalent to a +74.1% year-to-date (YTD) return.

Beyond absolute performance, EWY also leads in risk-adjusted returns, posting a Sharpe ratio of ~1.2x, the highest among the group (as shown in the right chart).

The Sharpe ratio measures how much return an investment generates relative to the risk taken, with higher values indicating more efficient performance. In simple terms, it helps determine whether returns are being driven by consistency rather than volatility alone. 

This strong showing reflects:

  • Heavy exposure to semiconductors and electronics
  • Direct leverage to the global AI and hardware cycle
  • Sustained foreign inflows into North Asia markets 

Source: Bloomberg 

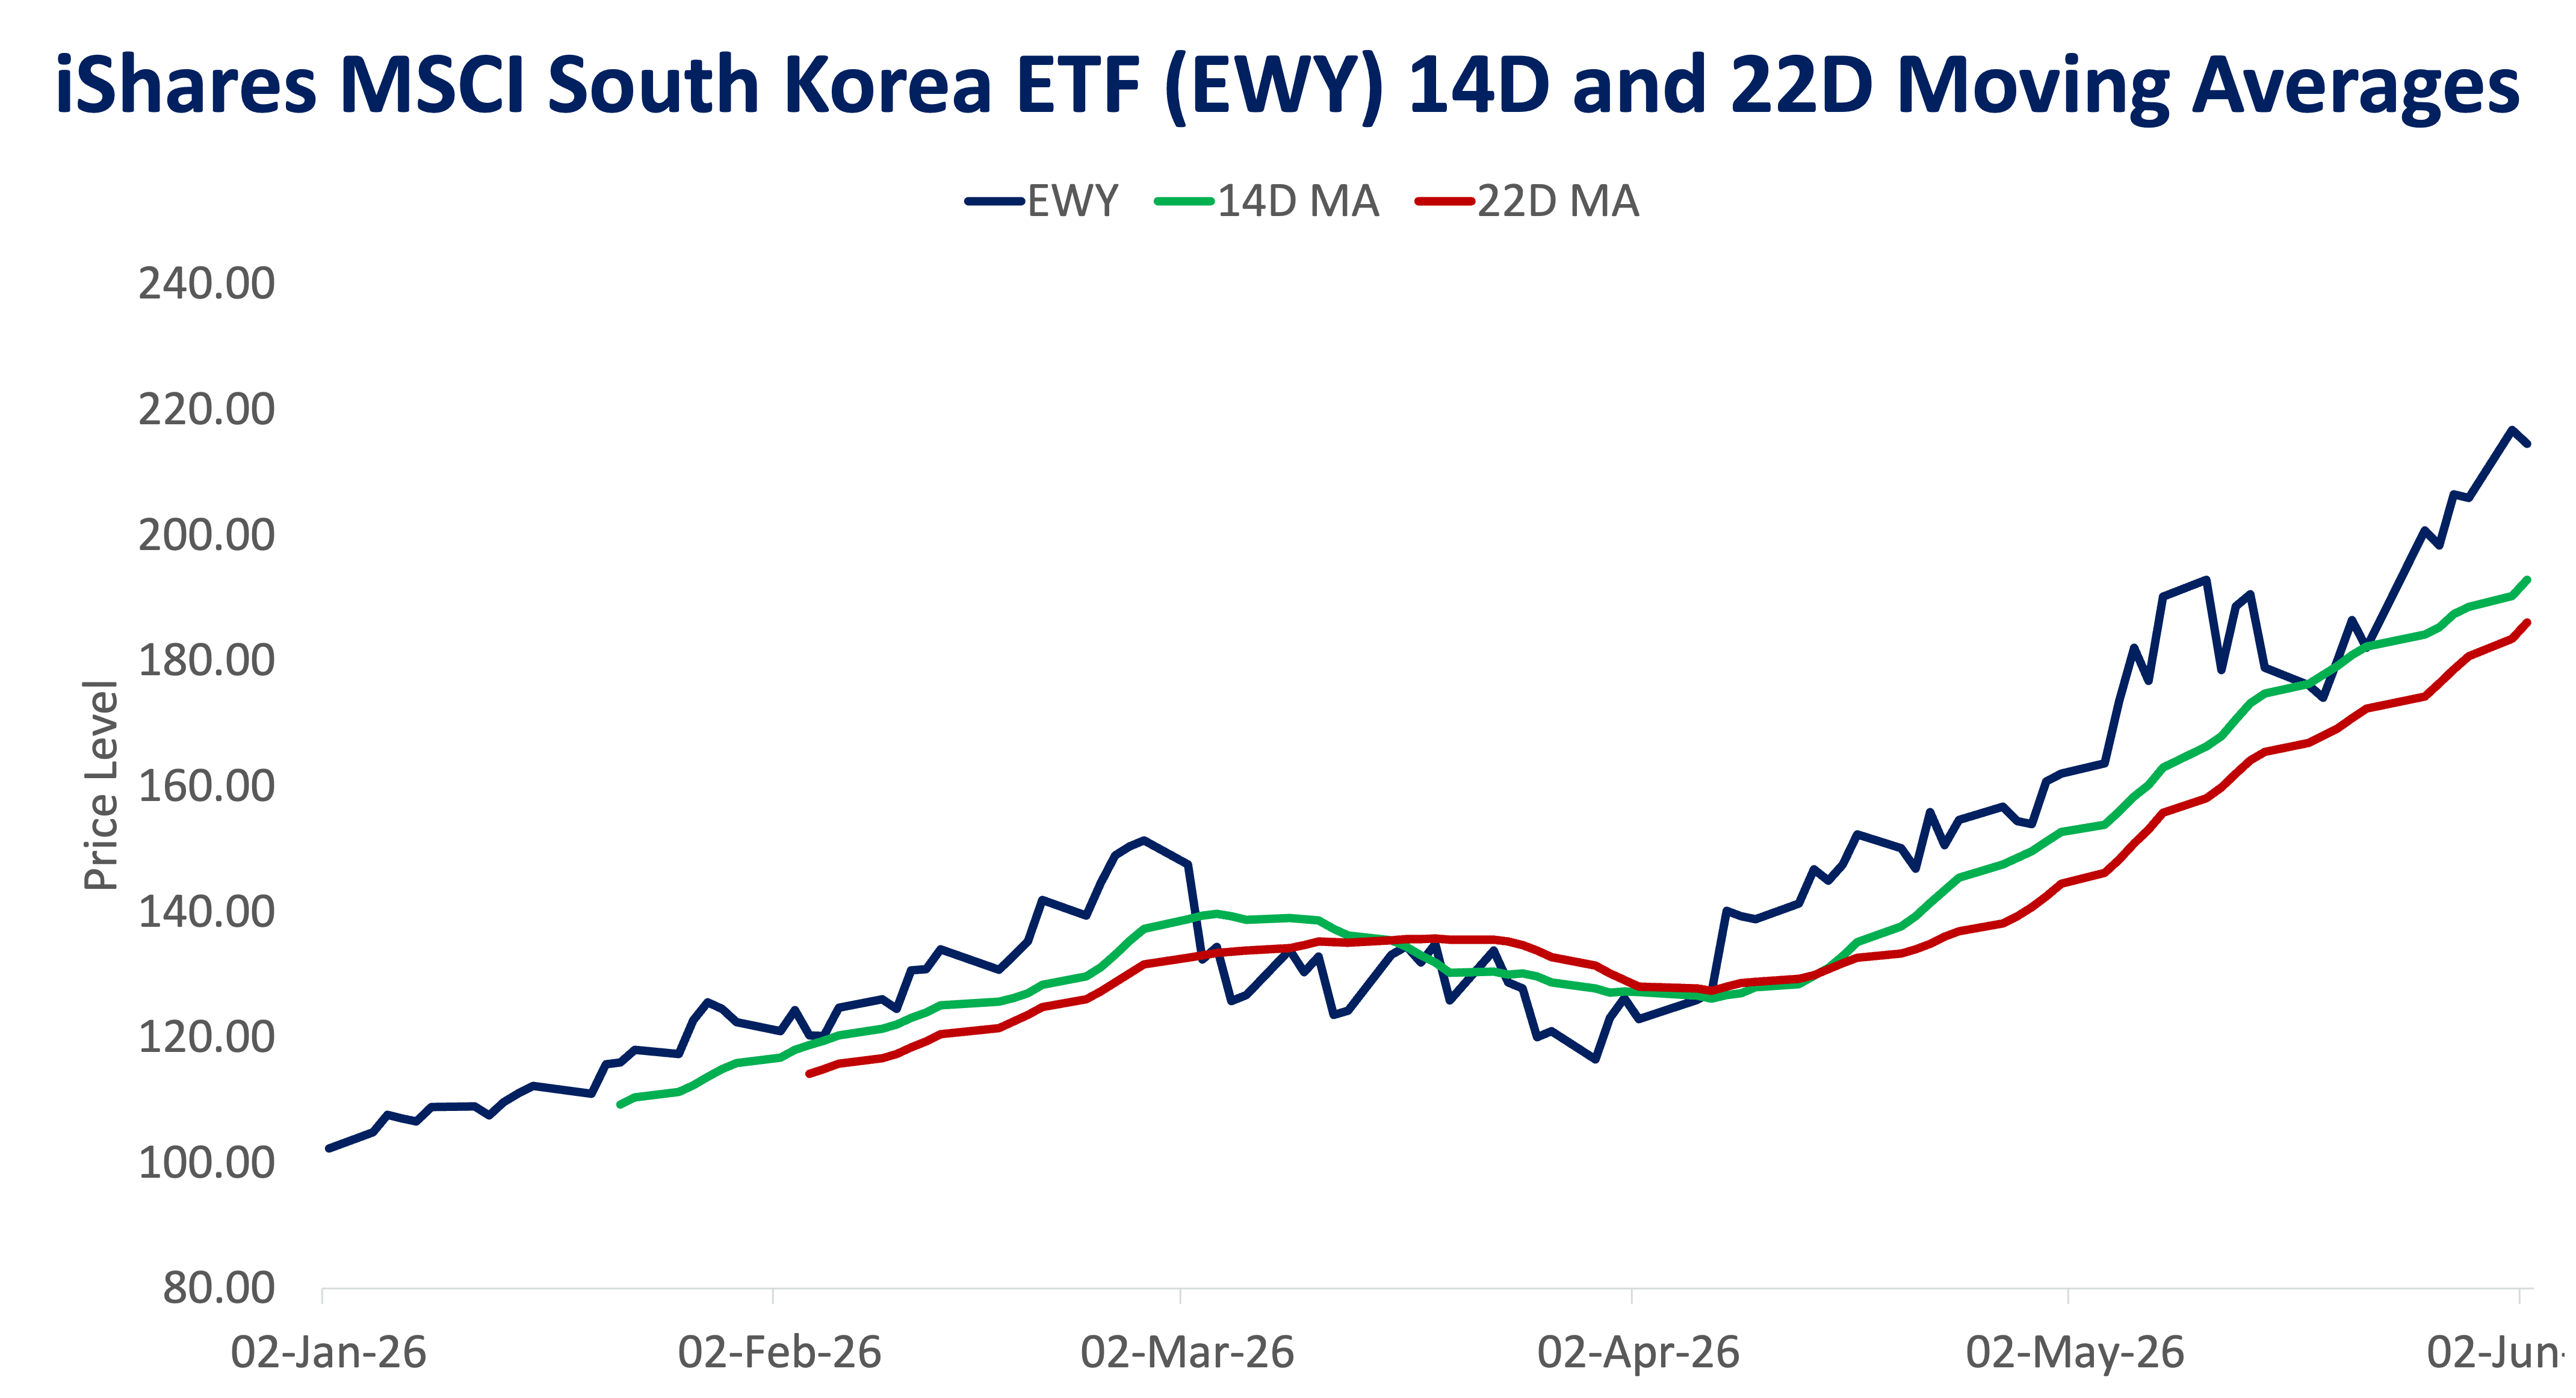
The technical trend further reinforces EWY’s leadership. As shown above, price action has remained consistently above both the 14-day and 22-day moving averages, with both indicators sloping upward. The widening gap between the shorter and longer-term averages suggests strong upward momentum with limited signs of trend exhaustion so far.

Beyond fundamentals, EWY’s rally is also being supported by firm technical strength, indicating sustained buying pressure and reinforcing its role as a near-term market leader.

EWY is currently the most efficient expression of global growth optimism—but also one that may carry elevated volatility given the magnitude of gains. 

US Tech (QQQ): Stable and Structural Growth


QQQ, which tracks the Nasdaq-100 Index, has delivered +19.6% YTD, supported by a steady upward trend, particularly since April.

Its Sharpe ratio of ~0.8x highlights a strong balance between return and risk.

Key drivers include:

  • Continued strength in AI, cloud, and digital platforms
  • Earnings resilience from large-cap technology names

QQQ remains a core portfolio holding, offering consistent growth with relatively efficient risk-adjusted returns.
 

Emerging Markets (EEM): Improving but Concentrated
 

Emerging markets have returned +23.0% YTD, outperforming global benchmarks such as ACWI.

However, the data suggests performance is:

  • Partly driven by North Asia, particularly South Korea
  • Not fully broad-based across all EM regions

With a Sharpe ratio of ~0.7x, EEM provides a balanced profile but lacks the outsized efficiency seen in EWY.
 

EM exposure is regaining traction, but selectivity within the asset class remains key. 
 

Global Equities (ACWI): Diversified but Diluted
 

ACWI has delivered a more moderate +11.6% YTD return, reflecting its broad exposure across regions. While diversification provides stability, it has also:

  • Limited participation in high-performing markets
  • Resulted in a lower Sharpe ratio (~0.5x)

In periods of high dispersion, broad exposure may dilute returns, reinforcing the need for tactical tilts.
 

Gold Shares (GLD): Early Strength, Fading Momentum
 

Gold rallied strongly earlier in the year, reaching around 150 on an index basis, before retreating to approximately 103, leaving a +3.4% YTD gain.

Its near-zero Sharpe ratio reflects weak risk-adjusted performance in the current environment.

This shift suggests:

  • Declining demand for safe-haven assets
  • A broader move toward risk-on positioning

Gold remains relevant for diversification, but is currently not a primary driver of returns. 

Precision matters more than ever

The charts point to a consistent theme: returns are no longer evenly distributed across markets.

Key implications include:

  • Shift from broad allocation to selective positioning
  • Maintain a core exposure to US tech (QQQ) for stability
  • Consider tactical allocations to high-performing regions such as South Korea
  • Reassess defensive allocations as gold momentum softens 

Bottom line

The year 2026 is shaping up to be a market defined by concentrated leadership and uneven performance. While global equities remain positive overall, a small number of markets are driving the majority of returns.

At present, South Korea stands out as the clear leader, while US tech continues to underpin portfolio growth. In this environment, precision allocation—not just diversification—will be the key differentiator for investors. 

(Disclaimer: This is general investment information only and does not constitute an offer or guarantee, with all investment decisions made at your own risk. The bank takes no responsibility for any potential losses.)

JANSSEN ROMAN is an Investment Counselor at Metrobank’s Financial Markets Sector, specializing in portfolio strategy, financial modeling, and data‑driven investment analysis. His experience spans roles as an Investment Specialist and Financial Markets Management Trainee at Metrobank, as well as a Research Analyst covering global Mutual Funds and ETFs at FactSet Philippines. He is currently pursuing his Master of Arts in Economics at the Ateneo de Manila University, with a focus on Fiscal Policy and Governance. He also holds a broad range of industry certifications spanning treasury, financial markets securities, financial modeling, data analytics, and process improvement—reinforcing his commitment to technical excellence and professional rigor. Outside of work, he enjoys riding his motorcycle, traveling, and photography.